Software licence · Monitoring & IT Operations
IT Resources
Monitoring, Service Desk & Operations Platform
Monitor firewalls, routers, servers, internet lines, VPNs and VOIP systems, alert the on-call engineer and run tickets, backups, a password safe and client billing from one self-hosted platform.
IT Resources is a self-hosted monitoring, service-desk and operations platform built for IT service providers and in-house IT teams. One server watches your firewalls, routers, switches, servers, workstations, internet lines, VPNs, VOIP systems and office devices, pages the on-call engineer when something breaks, and gives every client a scoped view of their own estate.
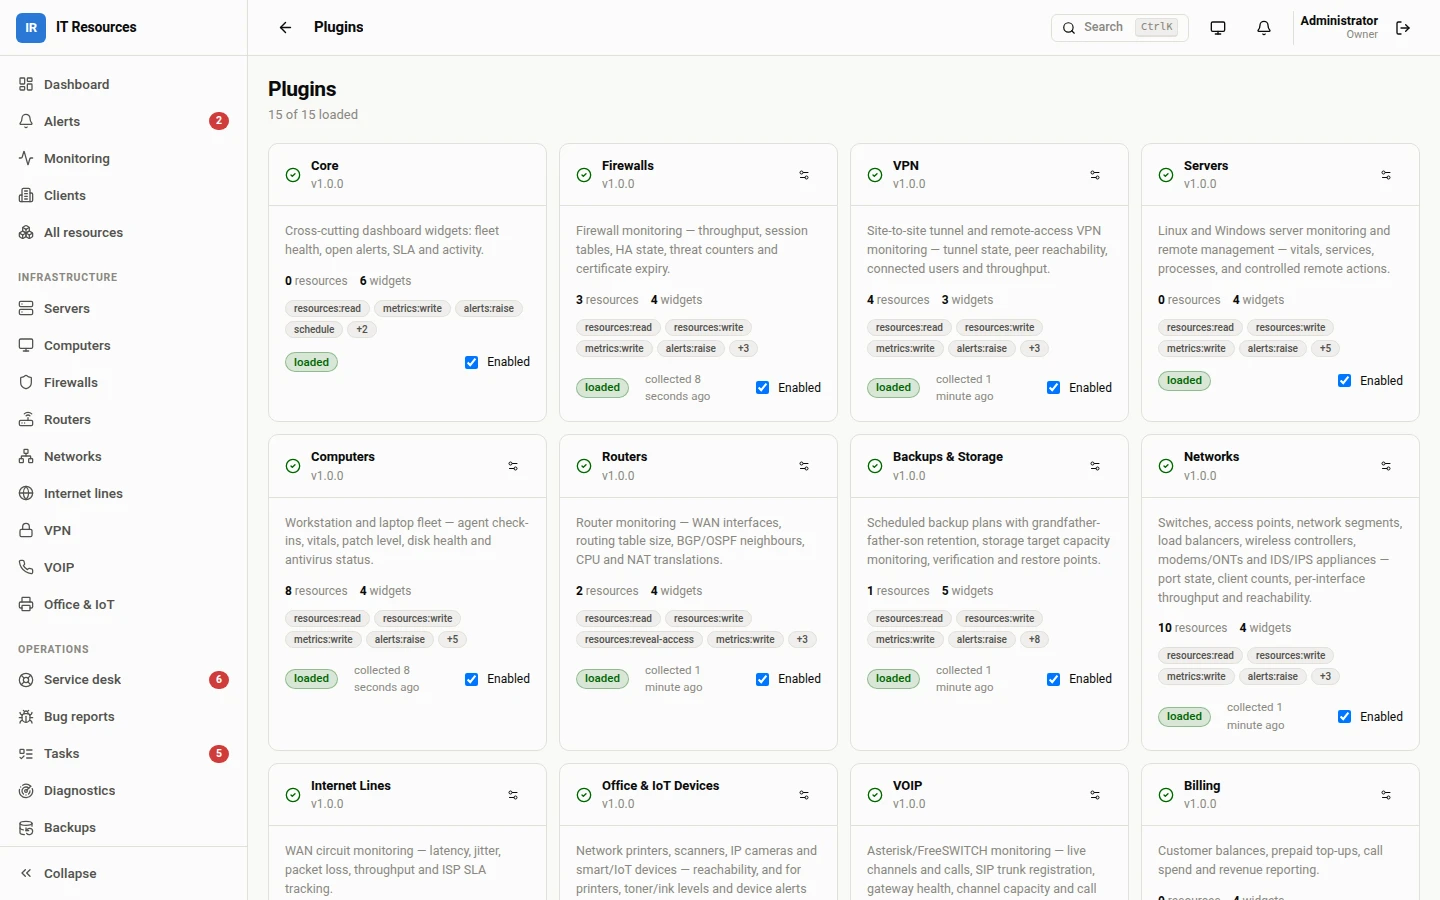
Everything monitorable is a plugin. The core stores resources, metrics and alerts; fifteen bundled plugins define what those mean for each kind of equipment, and you can add your own with the included plugin SDK.
- Multi-tenant by designClients, sites and resources, with tenant isolation enforced in the data layer and a portal for each customer.
- Agentless and agent-basedICMP, SNMP, SSH, HTTP, TLS, Redfish and Asterisk AMI probes, plus a push agent for hosts behind NAT.
- Alerting that stays quietDeduplication, debounce, escalation ladders and quiet hours, delivered by email, SMS, webhook and push.
- Security checks with treatmentsKnown vulnerabilities, signs of intrusion and login activity for every Linux server, PBX, dialer and MikroTik, each with remedies you review and apply one at a time.
- Operations in one placeService desk, tasks, password safe, backups, diagnostics, remote access, invoicing and utility bills.
- Runs on your own serverA single Docker container with an embedded SQLite database. No external database or message queue.
Monitoring
What each bundled plugin watches.
- Servers
- Linux servers over SSH or SNMP and Windows servers over the agent or SNMP: CPU, memory, disk, services and listening ports. Dell iDRAC and HPE iLO hardware health over Redfish. Proxmox host reachability.
- Computers
- Workstation and laptop fleet through agent check-ins: CPU, load, memory, uptime, per-volume disk usage, watched services and stale-host detection. Agentless workstations by reachability.
- Firewalls
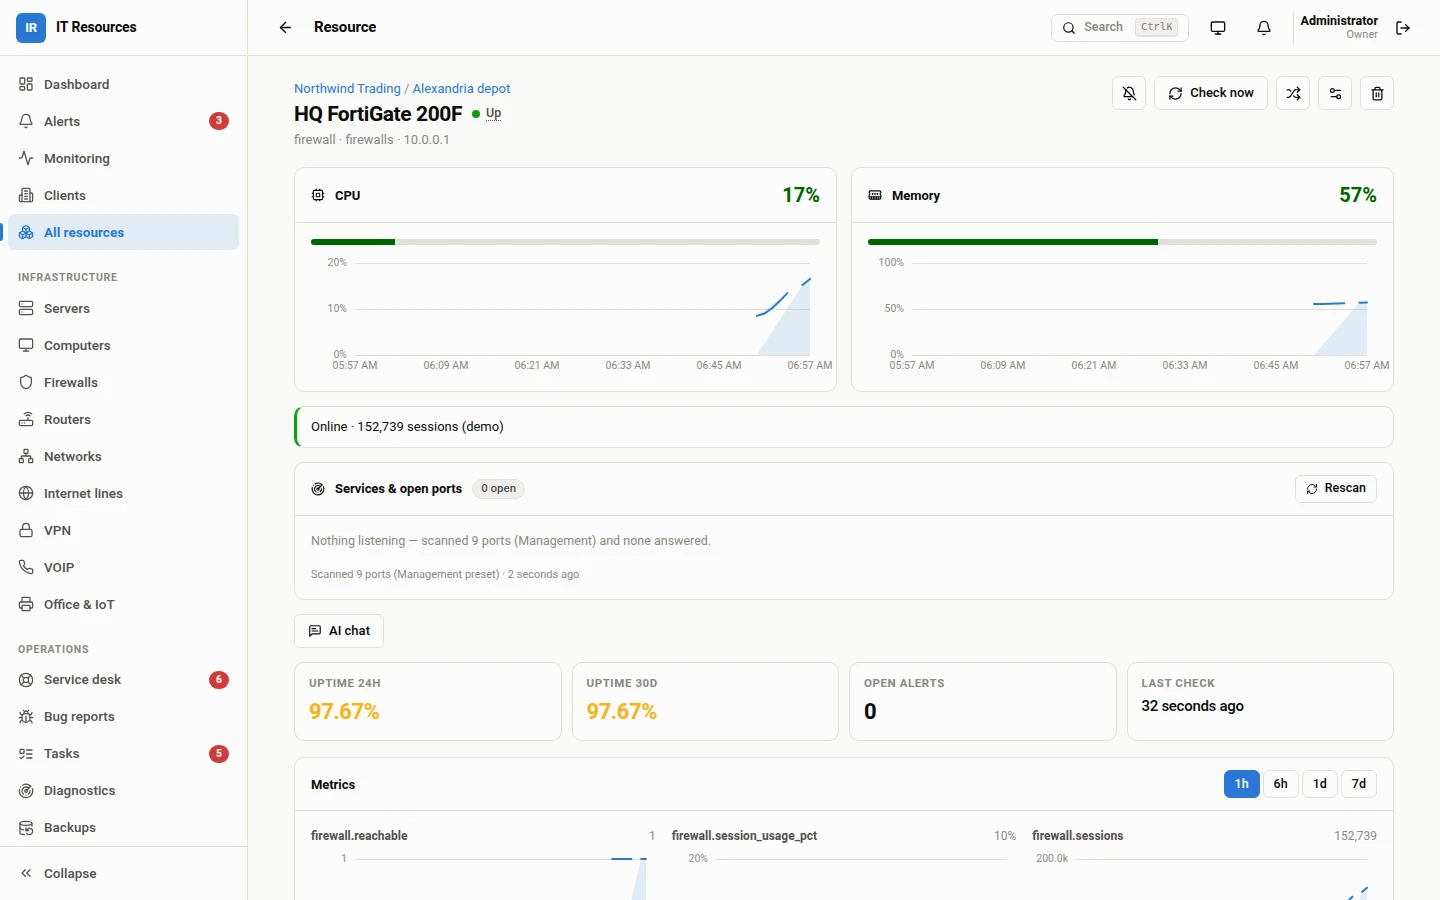
- Sessions, throughput, HA state, CPU, memory and certificate expiry for Fortinet FortiGate, Palo Alto, Sophos, MikroTik, pfSense/OPNsense and generic SNMP devices.
- Routers
- WAN interfaces, routing table size, BGP/OSPF neighbours and CPU for Cisco, MikroTik, Juniper, Huawei and generic SNMP devices.
- Networks
- Switches (port state, PoE, interface errors), access points and wireless controllers (associated clients), modems and ONTs, load balancers, IDS/IPS appliances and network segments.
- Internet lines
- Latency, jitter, packet loss and throughput per WAN circuit, with ISP SLA compliance.
- VPN
- Site-to-site tunnels (IPsec, WireGuard, OpenVPN, GRE, SSL) with flap detection, and remote-access servers with connected users.
- VOIP
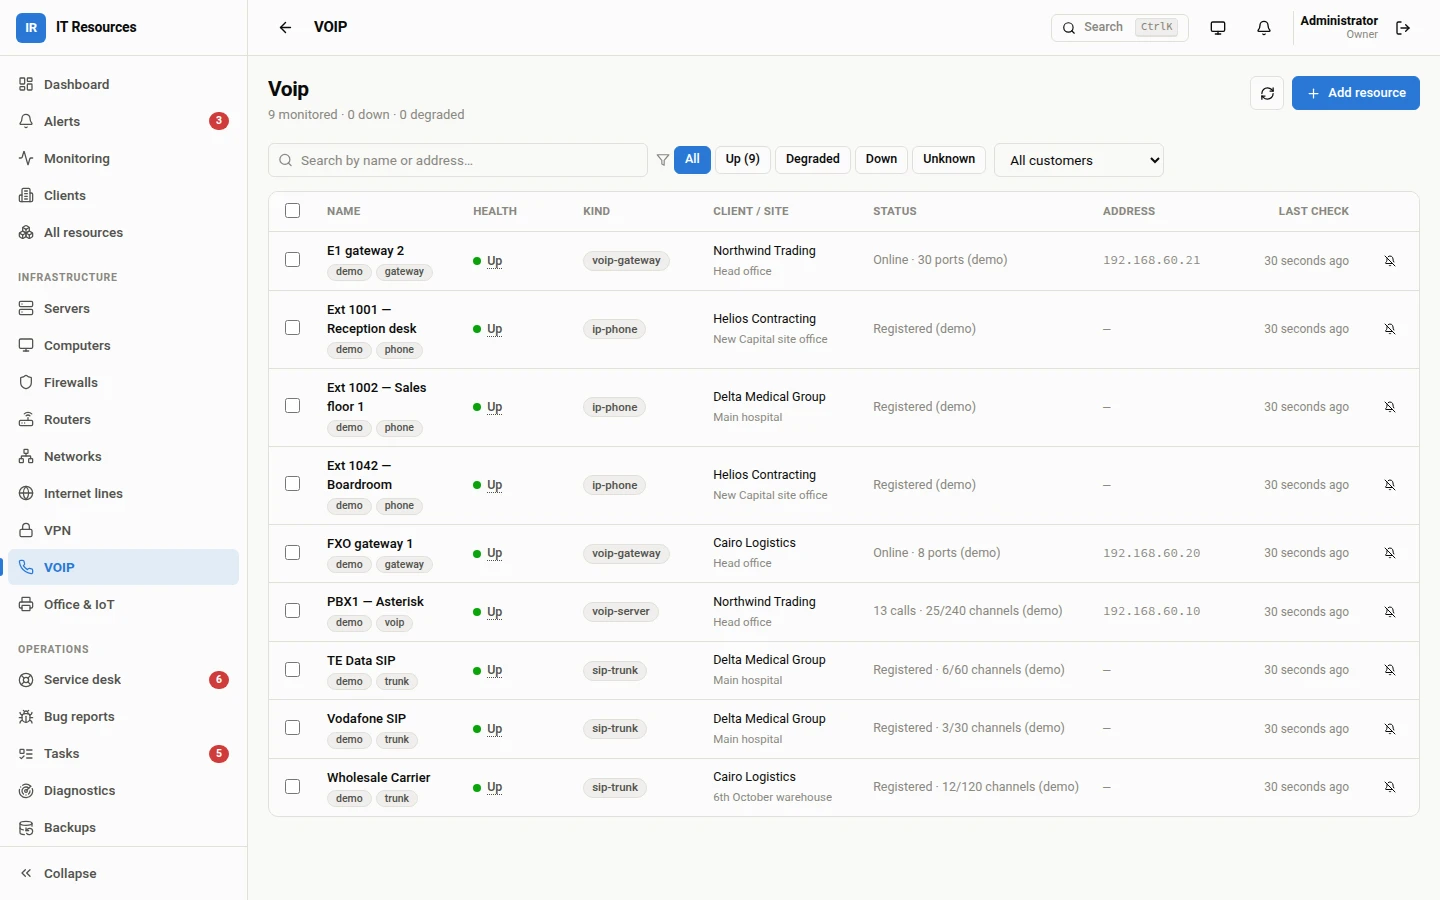
- Asterisk-based PBXs over AMI: live channels and calls, SIP trunks, channel capacity, call quality (MOS) and ASR/ACD. IP phones, FXO/FXS/E1/GSM gateways, GoIP gateways, ViciDial dialers and MagnusBilling servers.
- Office & IoT
- Printers and scanners (toner and ink levels, device alerts), IP cameras and NVRs (Hikvision, Dahua, Axis, Reolink, Amcrest, ONVIF) and other IoT devices.
- Backups & storage
- Storage targets monitored for capacity like any other resource, protection status and a recovery-point watchdog.
- Automatic discovery: every half hour the platform reads the ARP tables and DHCP leases of every MikroTik it manages. A device that moves to a new address is followed by its MAC – the resource's address updates itself, within the same client only, with every move logged – and newly seen devices are one click from being monitored.
- Connect as any user: an administrator opens the portal as another user for up to two hours to see exactly what that role can see and do – every action logged under both names.
- The server watches itself: the IT Resources host is a resource like any other – vitals, security check and treatments – with a dashboard widget for its CPU, memory, disk, uptime, process and database size.
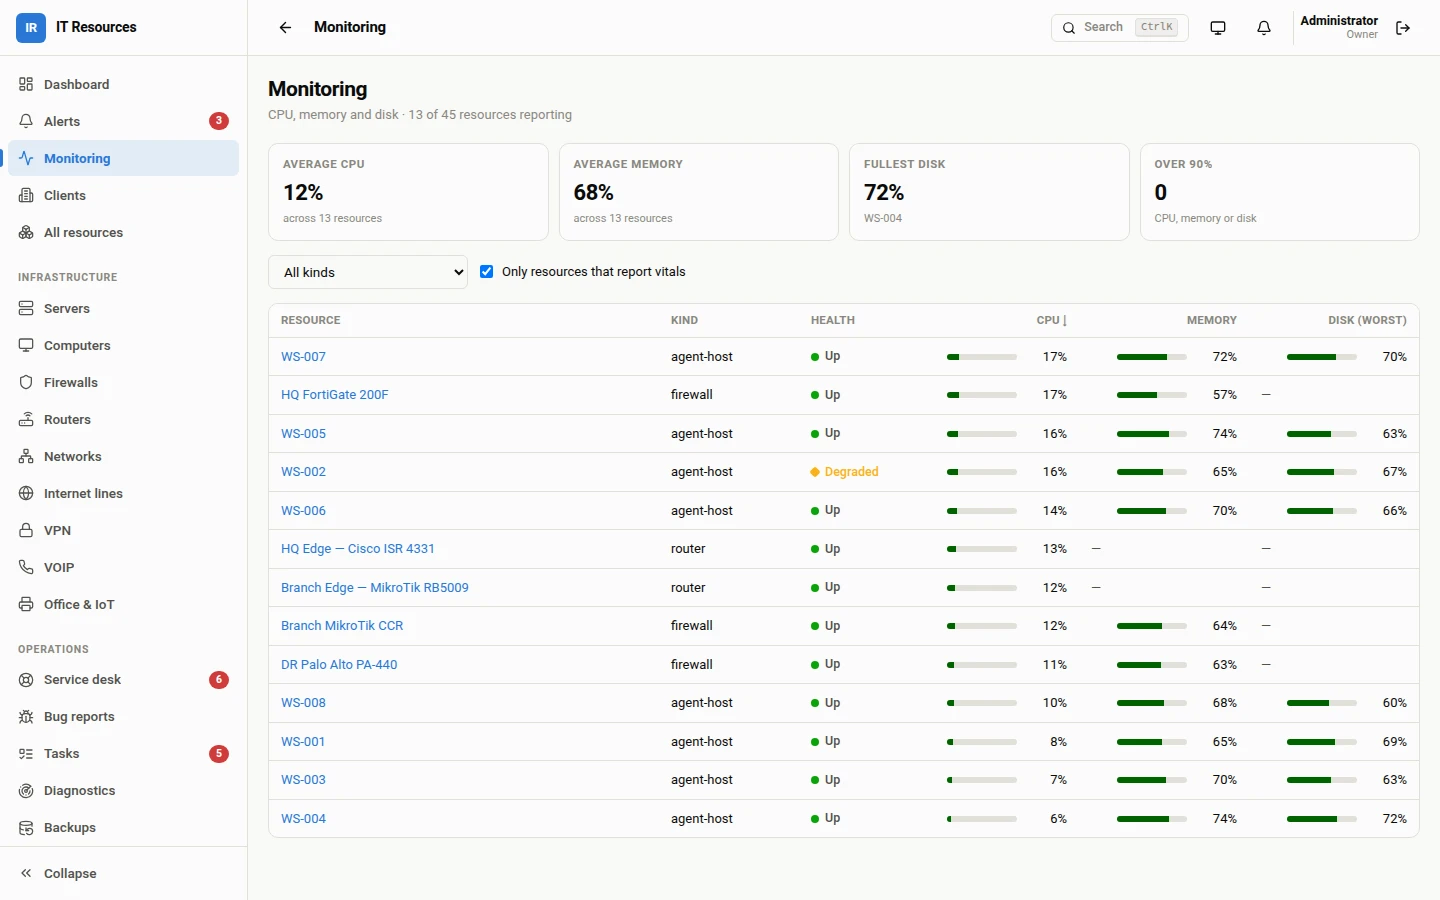
- Fleet-wide Monitoring view: sortable CPU, memory and worst-disk table across every resource that reports vitals.
- Per-resource page in tabs – Dashboard first (live vitals, services, 24-hour and 30-day uptime, open alerts, metric charts over 1 hour to 7 days), then Security, Services & ports, Access, Diagnostics, Backups and Details – and on MikroTiks Discovery, Configuration, Users and Torch tabs of their own. The open tab is part of the address, so it can be bookmarked and linked.
- Three metric retention tiers – raw for a day, 5-minute for a month, hourly for a year – so dashboards stay fast as history grows.
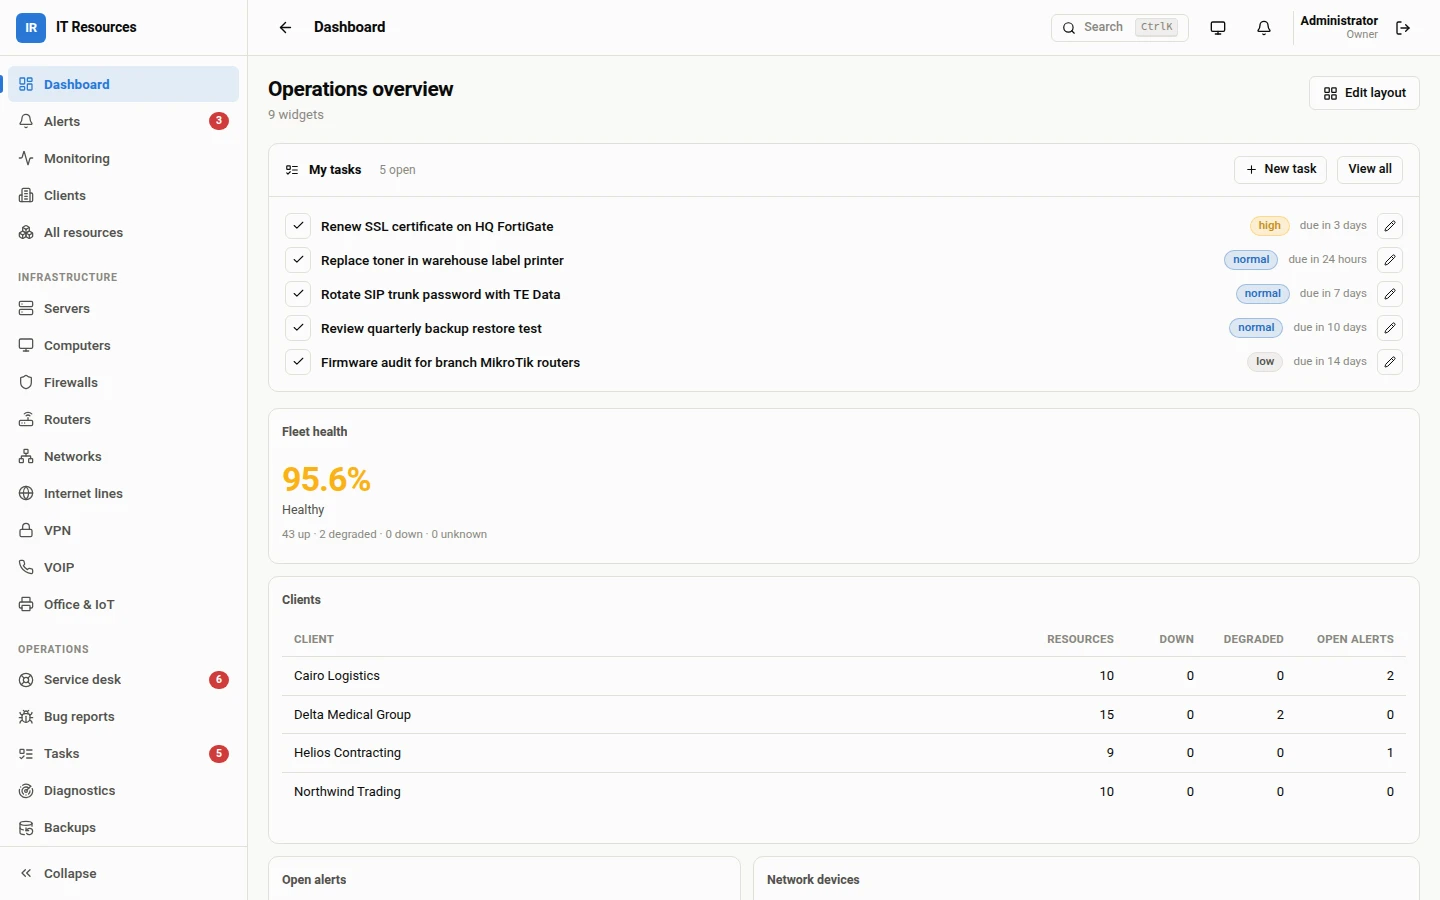
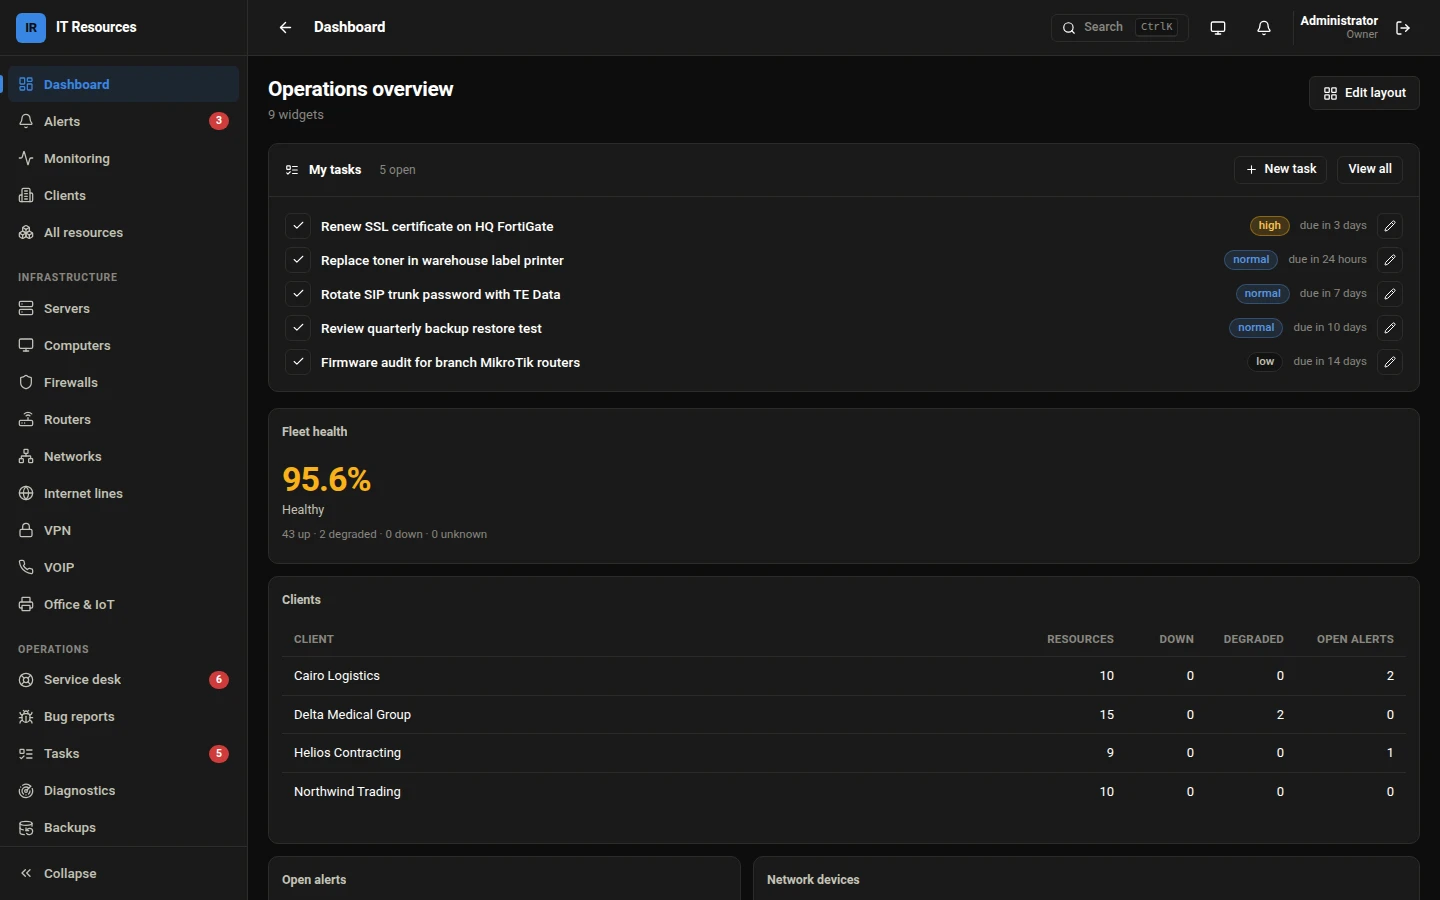
- Customisable dashboard: drag, resize and add widgets from every plugin – fleet health, status grids that show each device's client and branch, alert trend, worst uptime, live calls with the client and PBX behind each call, trunk status, call heat-map, backup protection, ticket queue, SLA and more.
Security checks
Is anything we look after vulnerable or already broken into – and what do we do about it?
What is checked
- Every Linux server, PBX, ViciDial dialer, MagnusBilling server and MikroTik is checked over SSH – on demand, and automatically once a day – using the login the platform already holds.
- Known vulnerabilities: installed packages are matched against each distribution's own advisories (Debian, Ubuntu, AlmaLinux, Rocky, Alpine, openSUSE via OSV.dev), so back-ported fixes count; RouterOS versions are matched against NVD. Each one is marked as fixable or not yet fixed, and every vulnerable package carries its own treatments: upgrade just that package, see what depends on it and which of its programs are running, or remove it when nothing needs it.
- Signs of intrusion: a successful login from an address that was guessing passwords, extra root-level accounts, recently changed SSH keys, programs running from temporary folders, crypto-miners, preloaded libraries, scheduled jobs that download and run code – and on MikroTik the botnet markers: SOCKS or web proxy switched on, fetch-and-import scheduler jobs, extra full-rights users.
- Hardening: SSH algorithms and options, passwords accepted from the internet, automatic security updates, kernel network settings, permissions on secret files, world-writable system files, unpackaged setuid programs, system binaries that no longer match their package, immutable-flagged files, hidden processes, needless daemons, time sync, auditing and password policy – and on MikroTik the forward chain, UPnP, RoMON, discovery scope, SSH strong-crypto, SYN cookies, unrestricted admin users and weak Wi-Fi profiles.
- Exposure: pending and security updates, reboots needed, databases and file sharing listening on every interface, SNMP with the default community, open DNS resolvers, management services open to the internet.
- Logs: failed and successful logins with the busiest sources and user names, sudo use and account changes.
- A fleet-wide Security page ranks everything worst first; intrusion signs raise a critical alert and serious fixable risks a warning, and both clear themselves once a later check is clean.
Treatments, one at a time
- Each finding – down to medium and low – offers its own treatments: inspections that only show (the account, the keys, the process, where a job lives) and fixes that change the device (install or automate updates, harden SSH, apply kernel settings, repair permissions, lock an account, stop and quarantine a program, reinstall tampered packages, block an address, restrict a service, enable a baseline firewall, protect a router's input and forward chains, turn off SOCKS or UPnP, upgrade RouterOS and more). Security updates leave the kernel and boot loader alone: those have a treatment of their own, which first checks that /boot has room and keeps the previous kernel in the boot menu, so one update cannot quietly decide the next reboot. A treatment's output streams live while it runs, and a report picks up newly added treatments the moment the platform is updated – no rescan needed.
- Changes that could cut the server off – a firewall, a router's chains – apply with a revert timer on the device; the platform then reconnects to confirm, and if it cannot, the device undoes the change by itself.
- You see exactly what will run before it runs; anything that interrupts service asks for a second confirmation. The device's output is shown and kept, with who ran it and when.
- Built not to lock you out: the platform's own address is never blocked, SSH changes are tested and rolled back if rejected, and a fix refuses to run while other machines depend on what it would close.
Alerting and response
From the first failed check to the engineer logged in to the device.
Alerting
- Rules on a metric threshold (for example average CPU above 90% for 5 minutes) or on health state (down for 2 minutes).
- Deduplication – one open alert per condition with a rising occurrence count, not sixty alerts for an hour-long outage.
- Debounce – a condition must hold before it fires, so flapping links stay quiet.
- No data is not a breach – a dead collector raises its own alert instead of tripping every threshold at once.
- Escalation ladders with per-step delays and channels, and quiet hours outside which only critical alerts page.
- Critical alerts can open a ticket automatically with the SLA clock running; resolution sends an all-clear to the same channels.
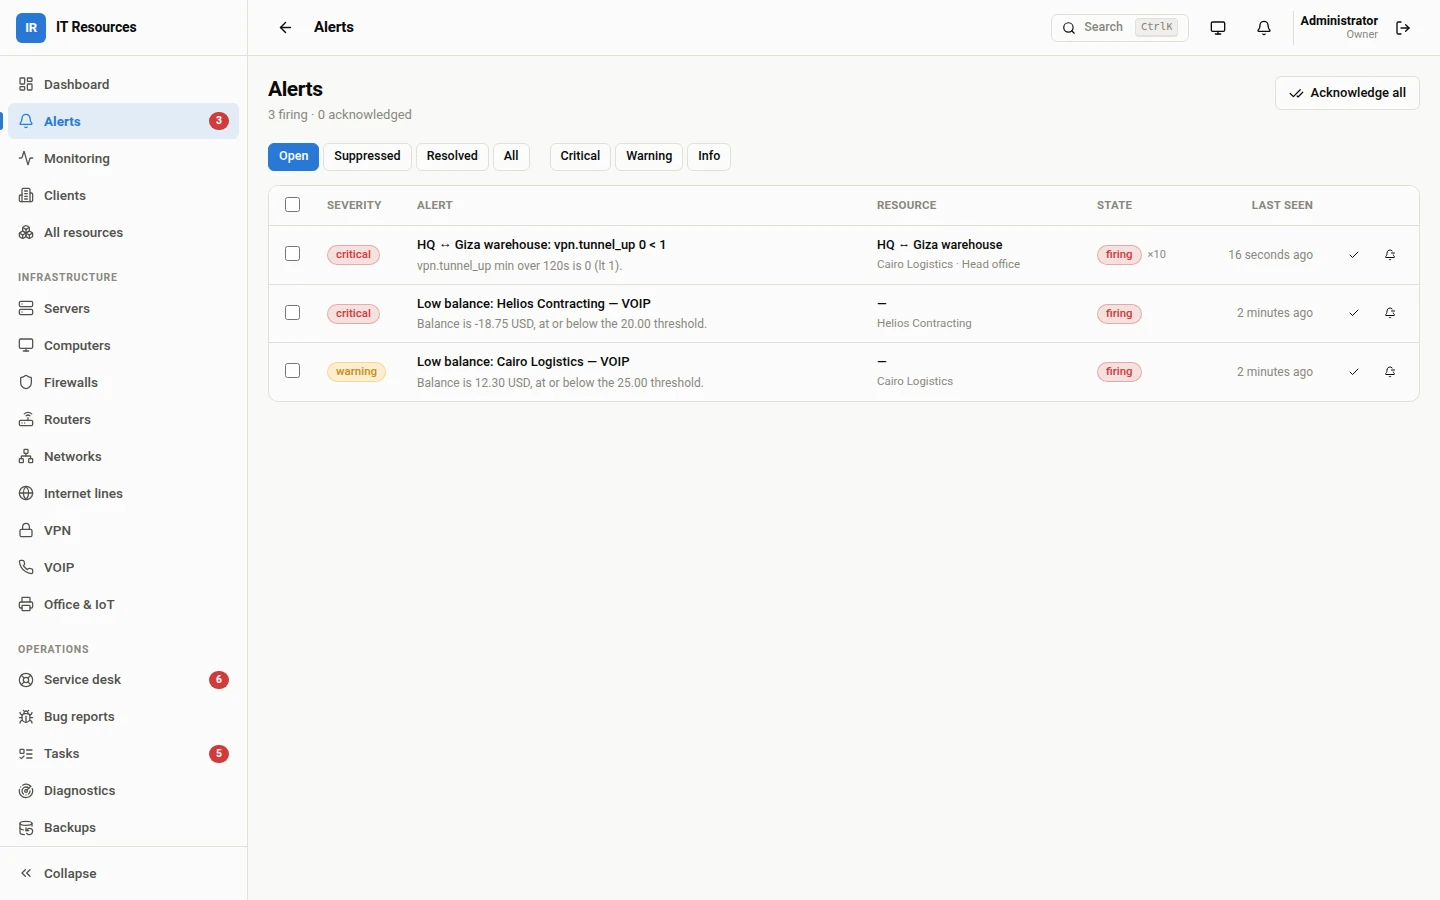
- Acknowledge, resolve or suppress alerts (with a duration and a reason), individually or in bulk.
- Channels: email (SMTP), SMS (Twilio or any HTTP gateway), webhook, in-app, browser push, mobile push, plus optional chime and spoken alerts in the browser.
Diagnostics and remote access
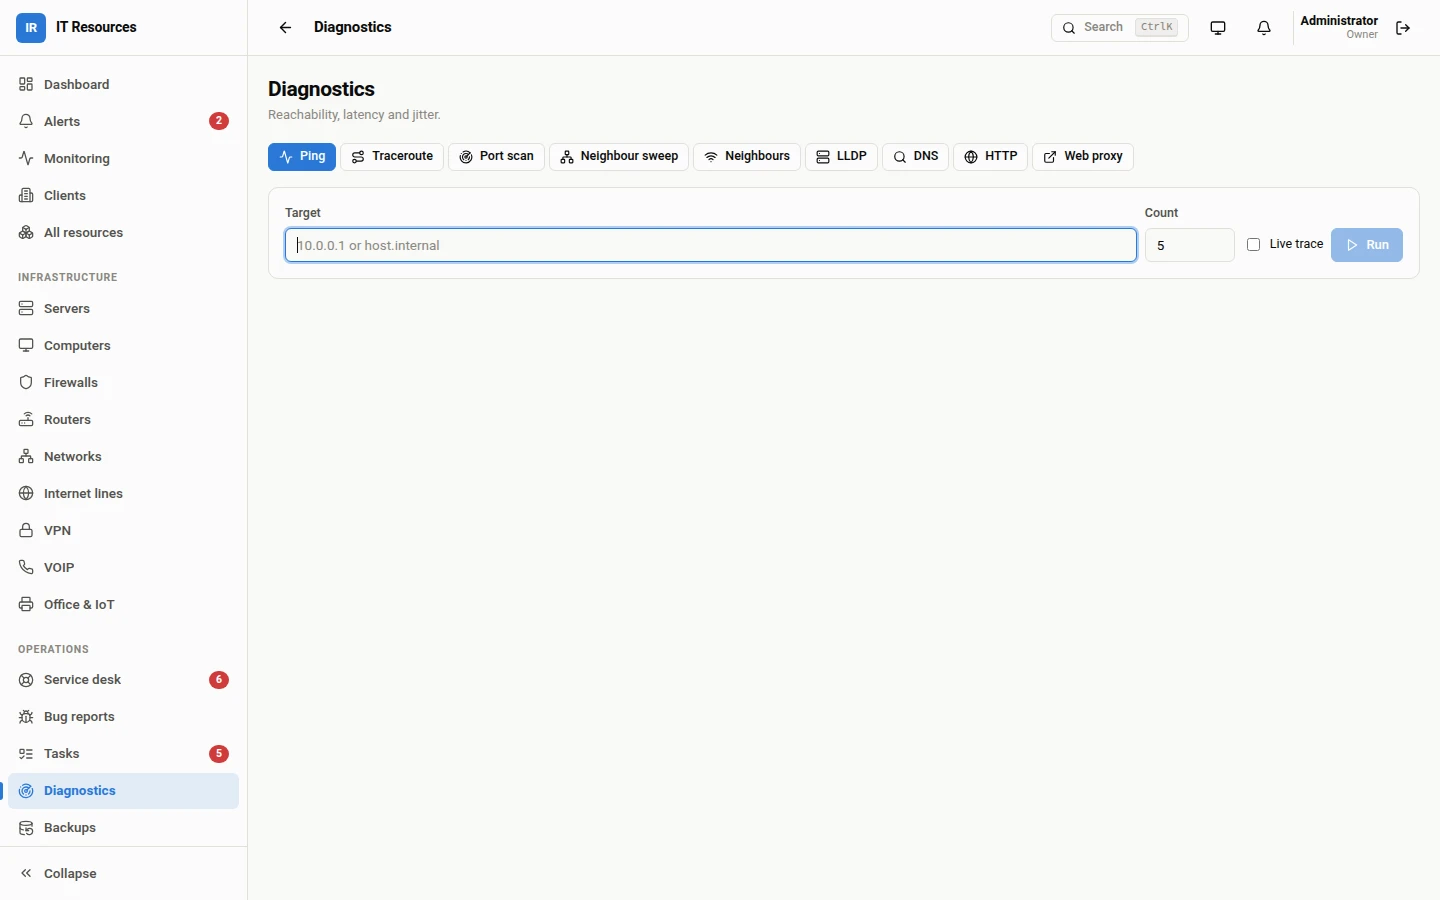
- Ping (one-off or continuous), traceroute, port scan, subnet sweep, DNS and HTTP checks, LLDP and the server's own neighbour table – with results streaming live.
- The same toolkit on every resource page, aimed at that resource's registered addresses.
- Access card per resource: tests SSH, Telnet, HTTP, HTTPS, Winbox, AMI and SIP ports and shows which doors are open.
- Browser terminal: SSH or Telnet sessions relayed through the server, using a saved vault credential or one you type. Session output is recorded server-side.
- Web proxy and port-forward tunnels to device admin interfaces on client LANs that the server can reach and your workstation cannot.
- Open-port scan with service banners on each resource, with the option to pin the ports you want to keep watching.
- Restrict which address ranges the tools may probe.
MikroTik toolkit
- Winbox tunnel through the server, and temporary Winbox/WebFig logins for technicians that are removed when the ticket closes.
- Device discovery from ARP, DHCP and neighbour tables – add a found device as a child resource in one click.
- Torch live traffic capture, and the nightly configuration export cached with secrets redacted.
- PCC load balancing: guided installer (discover ports, preview the plan, apply), live traffic per line, enable/disable lines and slots, renew DHCP, per-line diagnostics, with guards against cutting off the management line.
- VPN link discovery and guided protocol set-up, previewed before it is applied.
VOIP and call-centre monitoring
- Asterisk (including FreePBX, Issabel and Elastix systems) over AMI with SSH fallback: live calls and channels, trunk registration, channel usage against capacity.
- ViciDial server monitor: agents in call, ready and paused, calls being placed, live channels, system and Asterisk CPU, calls per carrier, today's dispositions and dialable leads per campaign – plus a streamed backup of the database (campaigns, lists, leads and users, without the call logs) and the Asterisk configuration.
- GoIP GSM gateways: per-line SIM and registration status, signal, carrier, ACD/ASR, remaining minutes, IMEI and ICCID, with remote reboot.
- Yeastar and Dinstar gateways: per-line status, signal and call limits with an online/busy history chart, and configuration backup.
- MagnusBilling live view: calls in progress, concurrent calls, trunks, CPU, memory and disks, with database and configuration backup over SSH.
Running the business
The day-to-day work around the monitoring, kept next to the devices it concerns.
Clients, sites and reporting
- Organise resources by client and site; each client sees only their own resources, tickets and balance.
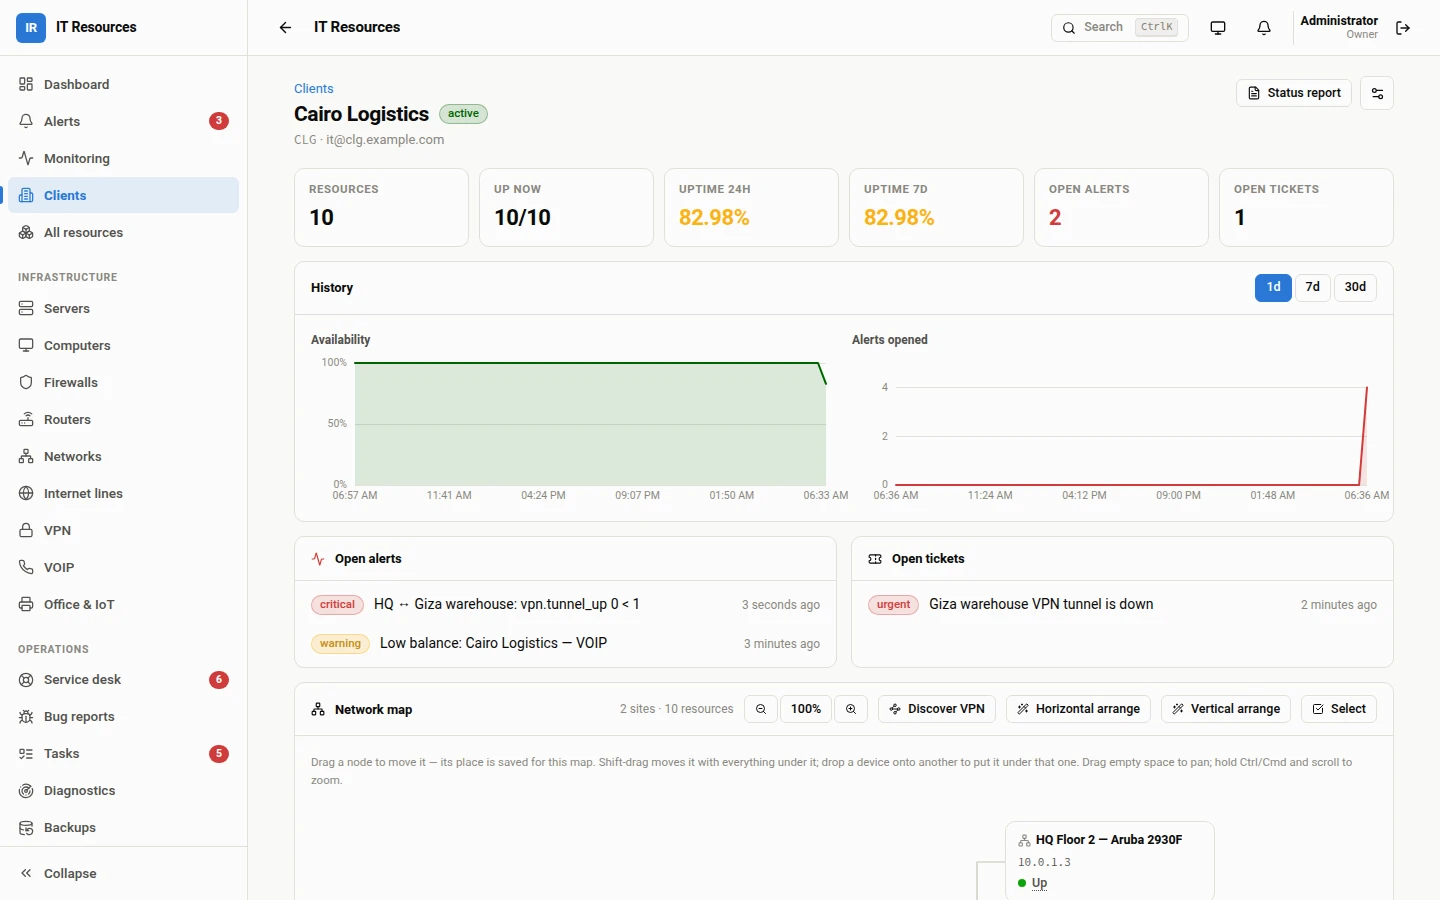
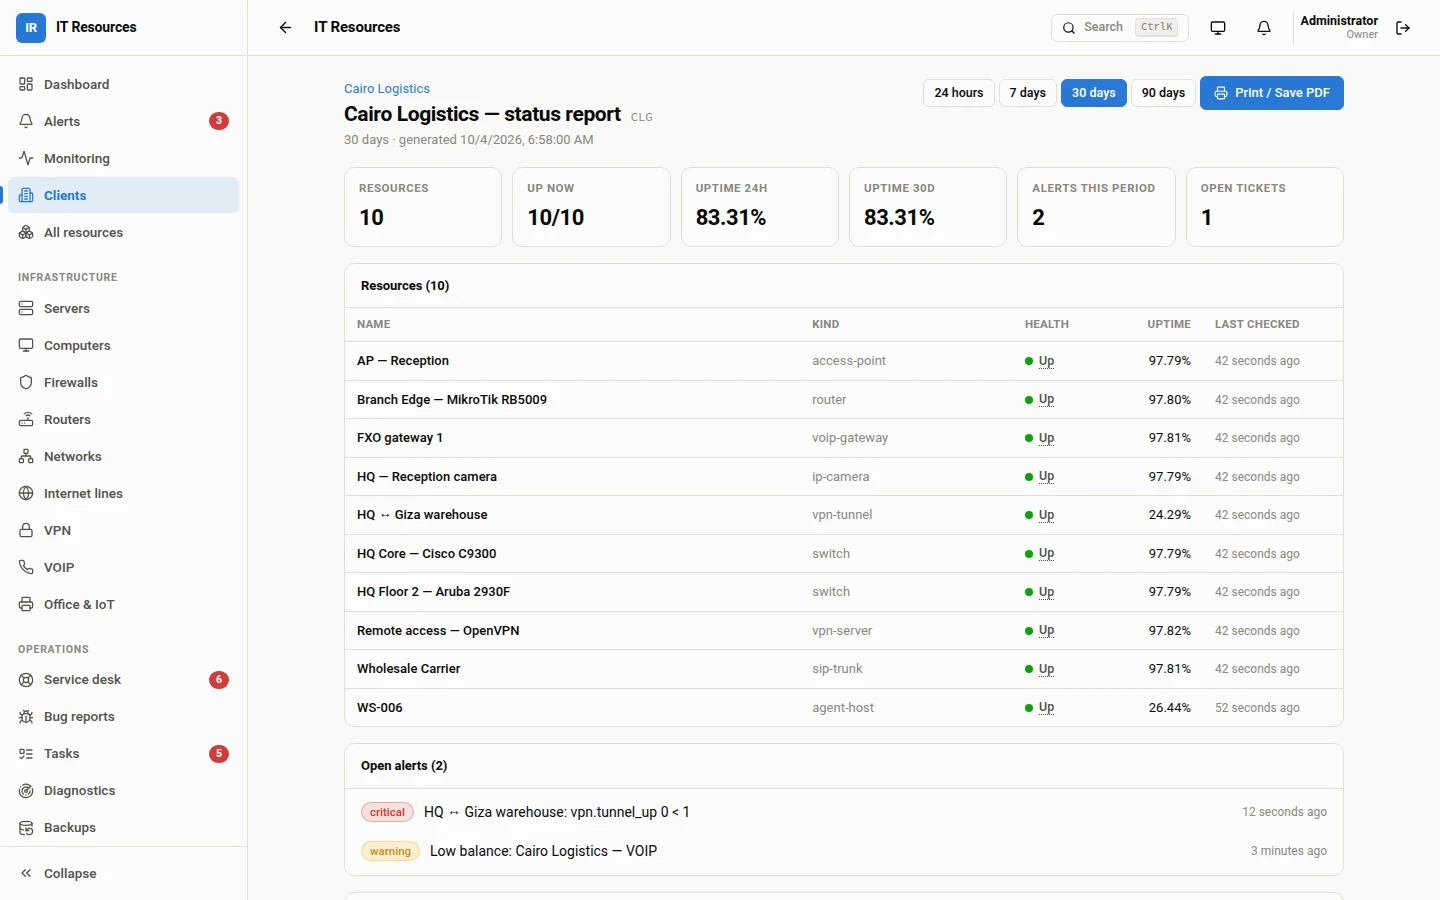
- Client page with live health, uptime history, open alerts, subscriptions, invoices and utility bills in one place.
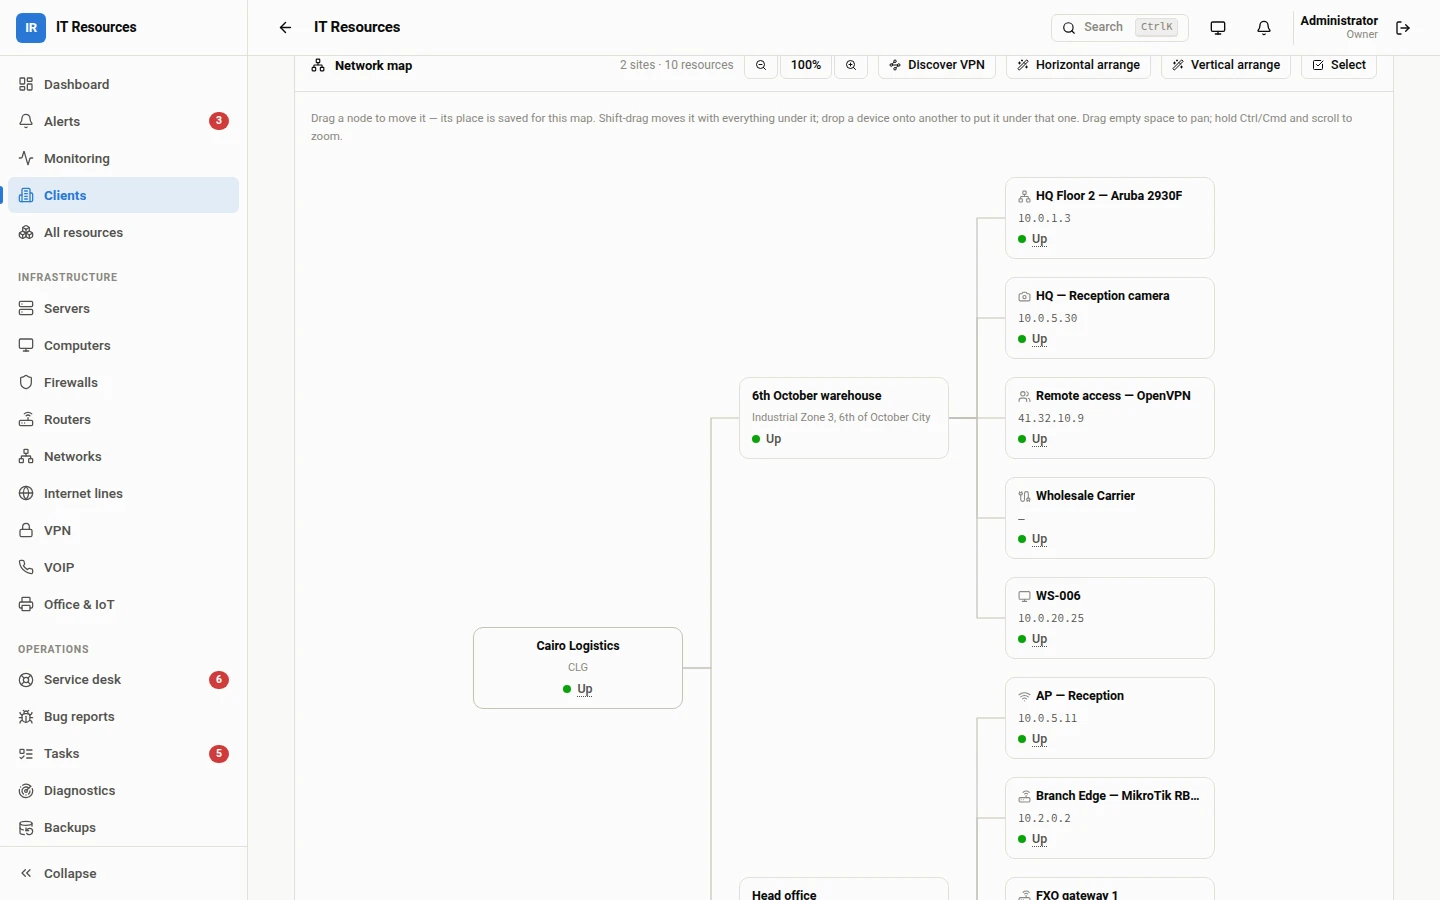
- Interactive network map per client and per site: drag to arrange, drop a device onto another to re-parent it, VPN links drawn between sites, layout saved for everyone.
- One-click status report for a client over 24 hours, 7, 30 or 90 days, ready to print or save as PDF.
- Invite client-side teammates with viewer or admin rights over their own tenant.
Service desk, bug reports and tasks
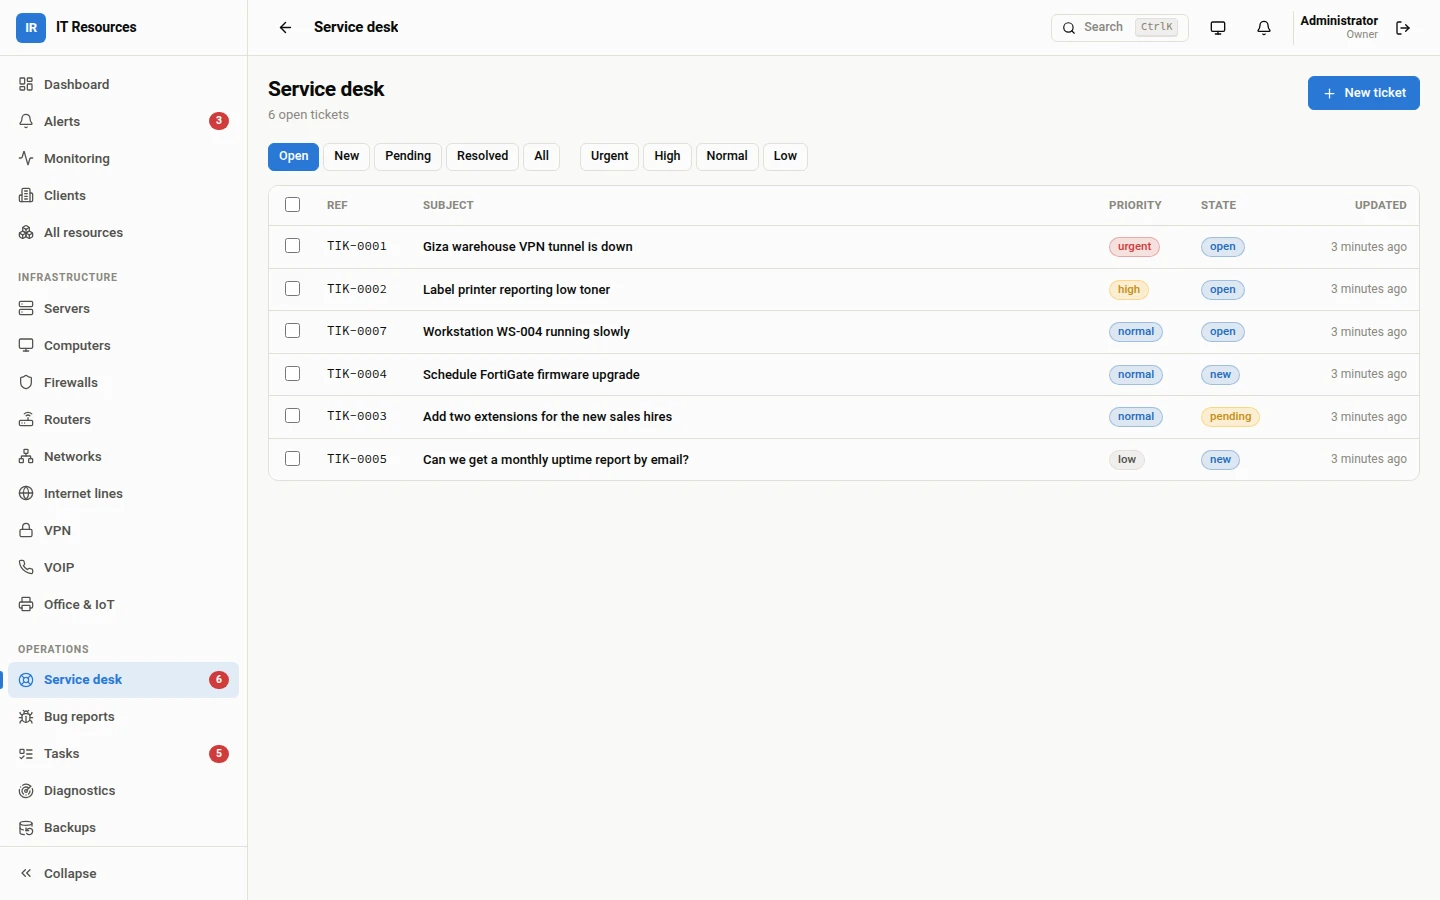
- Tickets by type (incident, request, change, question, bug) with priority, state, assignee, comments and internal notes.
- SLA targets per priority with breach tracking, queue health and agent workload widgets.
- Tickets link to the client and the resource they concern; support fees can be charged from the ticket.
- Bug reports with severity, component and reproduction steps, deduplicated by fingerprint with a hit count.
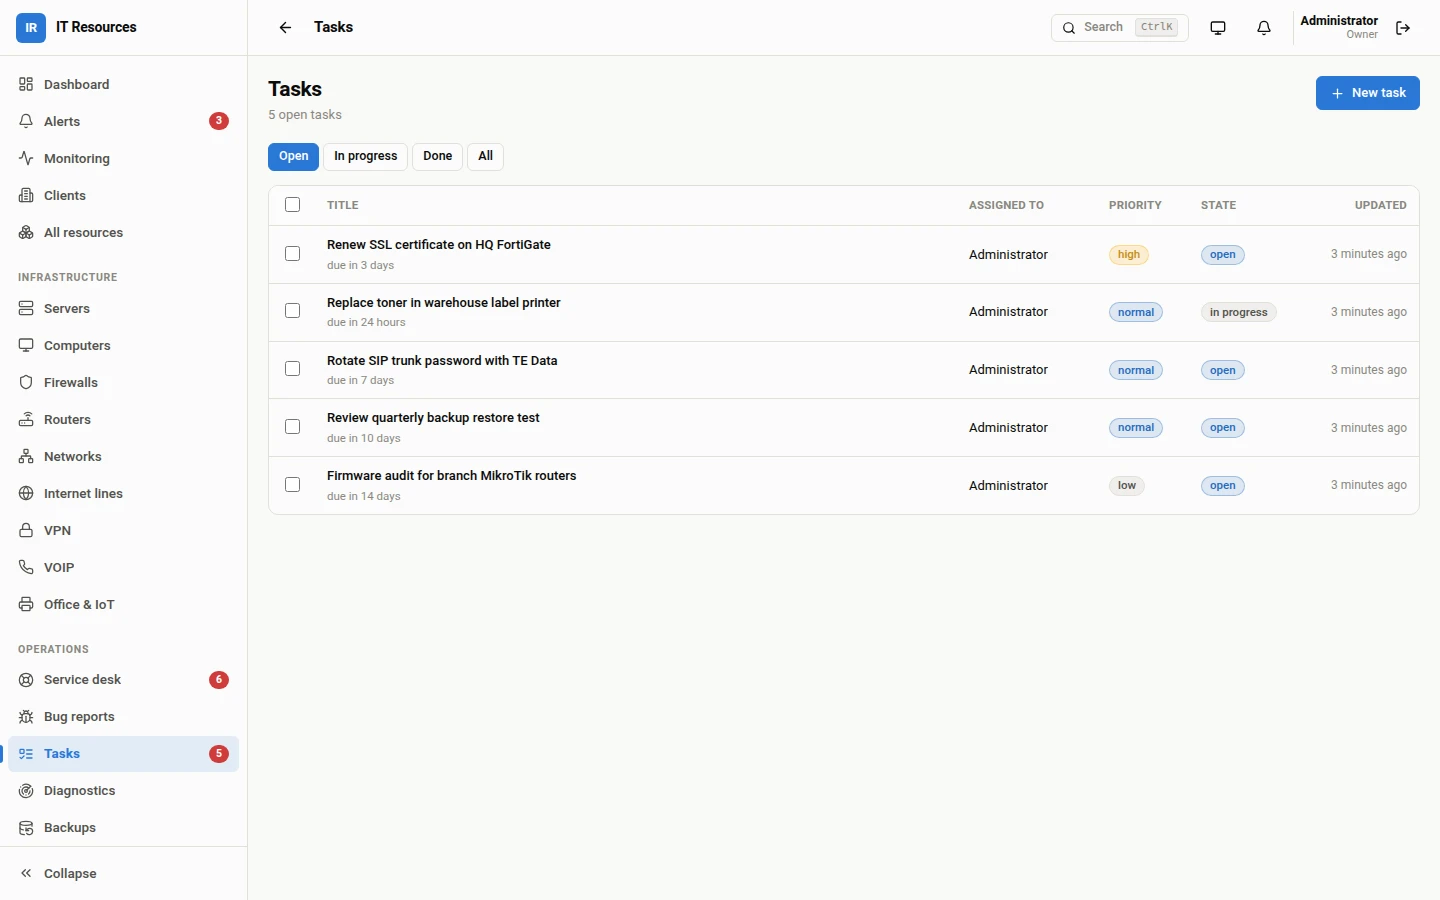
- Tasks with assignee, priority and due date, linked to a client or resource, and a "My tasks" panel on the dashboard.
Password safe
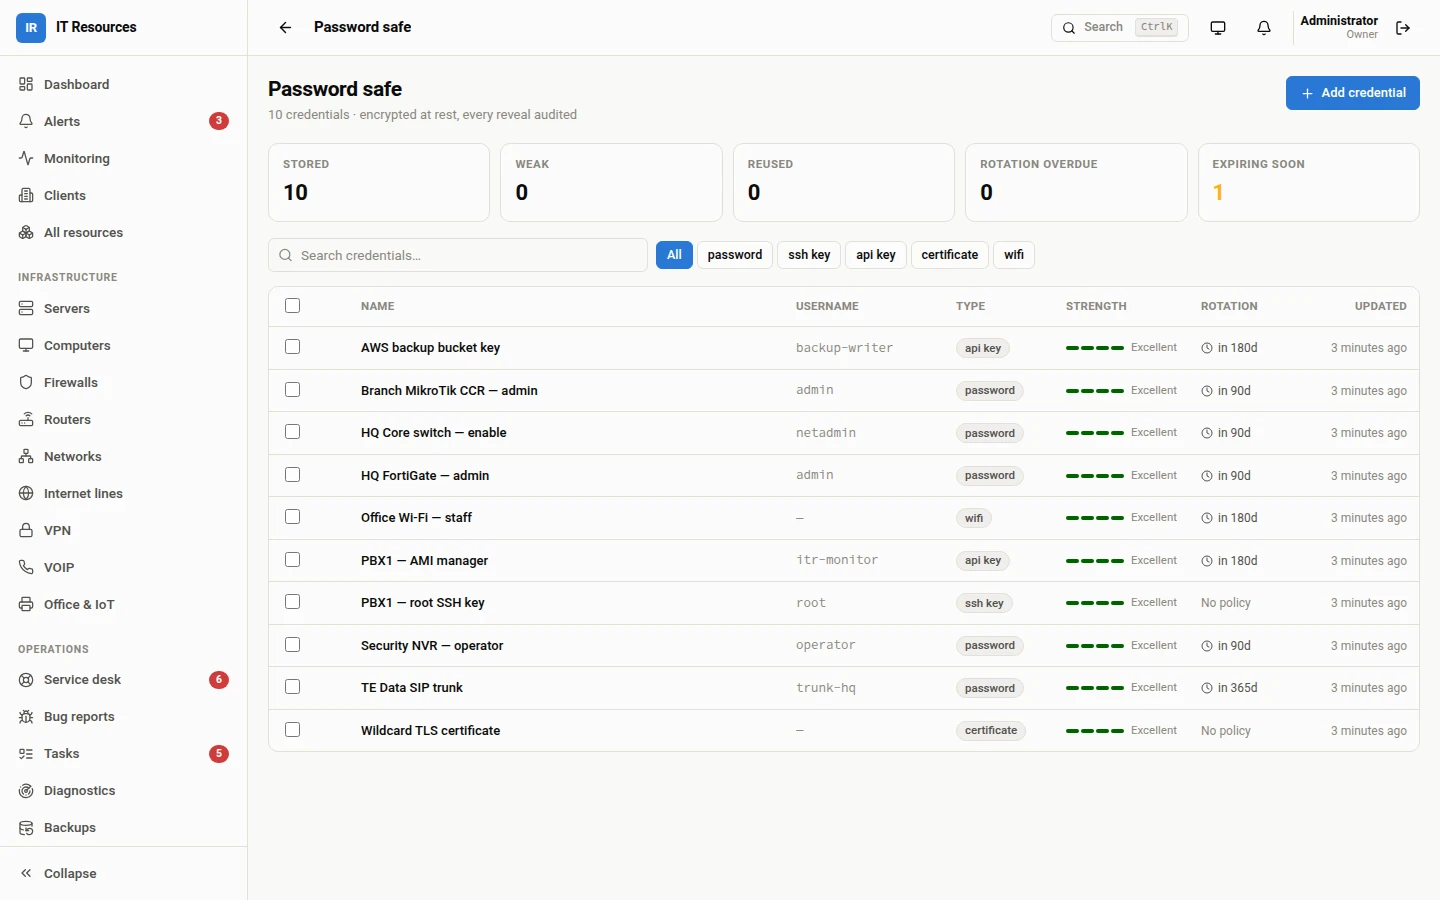
- Stores passwords, SSH keys, API keys, certificates, Wi-Fi keys, licences, database logins and notes, linked to the resources they belong to.
- Envelope encryption with per-entry AES-256-GCM; a stolen database file is inert without the server's key.
- Seeing a secret needs a separate "reveal" permission, every reveal is audited before the plaintext is returned, and revealed secrets clear from the screen after 30 seconds.
- Posture overview: weak, reused, rotation-overdue and expiring credentials. Entropy-based strength scoring, password generator and TOTP codes.
Backups
- Pick what to protect from check lists: the server's databases and its folder tree are listed over SSH, and one plan can back up databases and files together into a single archive.
- Scheduled plans for files, MySQL/MariaDB, PostgreSQL, SQLite, device configuration over SSH, NocoBase in Docker (its database, storage and compose files) and the platform's own database.
- Storage targets: local or mounted path, SFTP, FTP/FTPS, WebDAV, S3-compatible, SMB and NFS, each with a connection test.
- Grandfather-father-son retention, checksummed archives, run logs, restore, and an optional offsite copy.
- RPO watchdog that catches the plan that silently stopped running.
Billing, invoices and utility bills
- Recurring plans and subscriptions (monthly, quarterly, yearly), one-time charges, invoice generation, renewals, payments and invoice templates; print or email invoices.
- Prepaid accounts with top-ups, adjustments, refunds, low-balance alerts and credit-limit suspension.
- Utility bills: track each client's internet, electricity, phone, leased-line and MPLS bills with due-date reminders, so a lapsed vendor payment never takes a site offline.
AI assistance (optional)
- Root-cause analysis on alerts and tickets using read-only tools: metric history, configuration, ping, traceroute, port and DNS checks and recent alerts.
- AI chat on resources, alerts and tickets. Any action it proposes – acknowledging an alert, rechecking a resource, commenting on a ticket, running a device command – needs explicit human approval.
- Works with Anthropic Claude (your own API key) or a local Ollama model.
Platform
How it is secured, reached and extended.
Security and access control
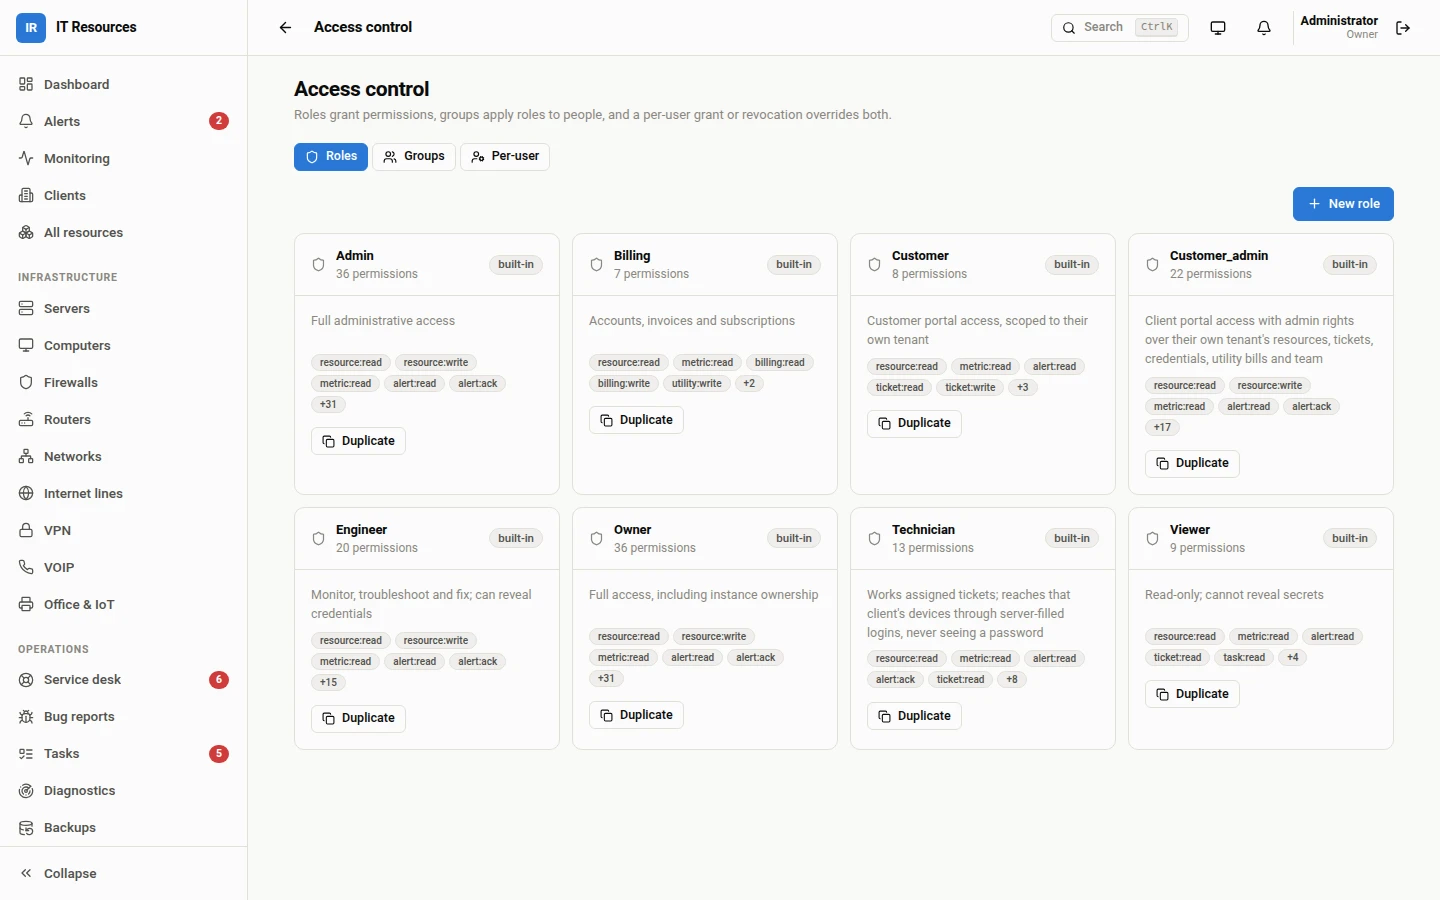
- Built-in roles (owner, admin, engineer, technician, billing, viewer, customer, customer admin), custom roles, user groups and per-user permission overrides.
- Two-factor authentication by authenticator app with backup codes, or by email code.
- Short-lived access tokens with refresh tokens that are stored hashed and rotated on use.
- Brute-force protection: repeated failed sign-ins are slowed per address and per account, and the client address in the audit log cannot be forged.
- Device credentials, SNMP communities and AMI secrets encrypted at rest and never returned by the API.
- Optional encrypted database (SQLCipher) unlocked with a passphrase at start-up.
- Remote server actions need both the operator's role and a per-server opt-in. Full audit log, with a separate log for vault access.
Clients and apps
- Web portal – responsive, light and dark themes, adjustable density and text size, high-contrast and reduced-motion options, and a command palette (Ctrl/⌘ K) that searches resources, alerts and tickets.
- Desktop app – the portal in a native window with a tray icon and close-to-tray.
- Android and iOS apps for on-call engineers – alerts, clients, diagnostics, security checks and treatments, backup plans with the same database and folder check lists, connect as another user, and push notifications.
- Host agent – a single zero-dependency script that dials out, so it works behind NAT and corporate firewalls. One-line installer for Linux and macOS.
Extensible
- Plugin SDK with real probes (ICMP, TCP, HTTP, TLS, SNMP, SSH, Asterisk AMI). A plugin is a folder with a manifest and one TypeScript file – drop it in and restart.
- Plugins declare the permissions they need, so you can see what third-party code can touch before enabling it.
- Widgets return data rather than markup, so the same widget renders on web, desktop and mobile.
System requirements
- A Linux server with Docker (recommended), or Node.js 20.11 or newer.
- No external database – SQLite is embedded. Storage grows with the number of resources and the metric history you keep.
- Network reachability from the server to the devices you want to monitor (host networking is recommended so LAN discovery and ICMP see the real network).
- Optional: an SMTP account for email, a Twilio account or HTTP SMS gateway for SMS, and an Anthropic API key or Ollama server for AI assistance.
How licensing works
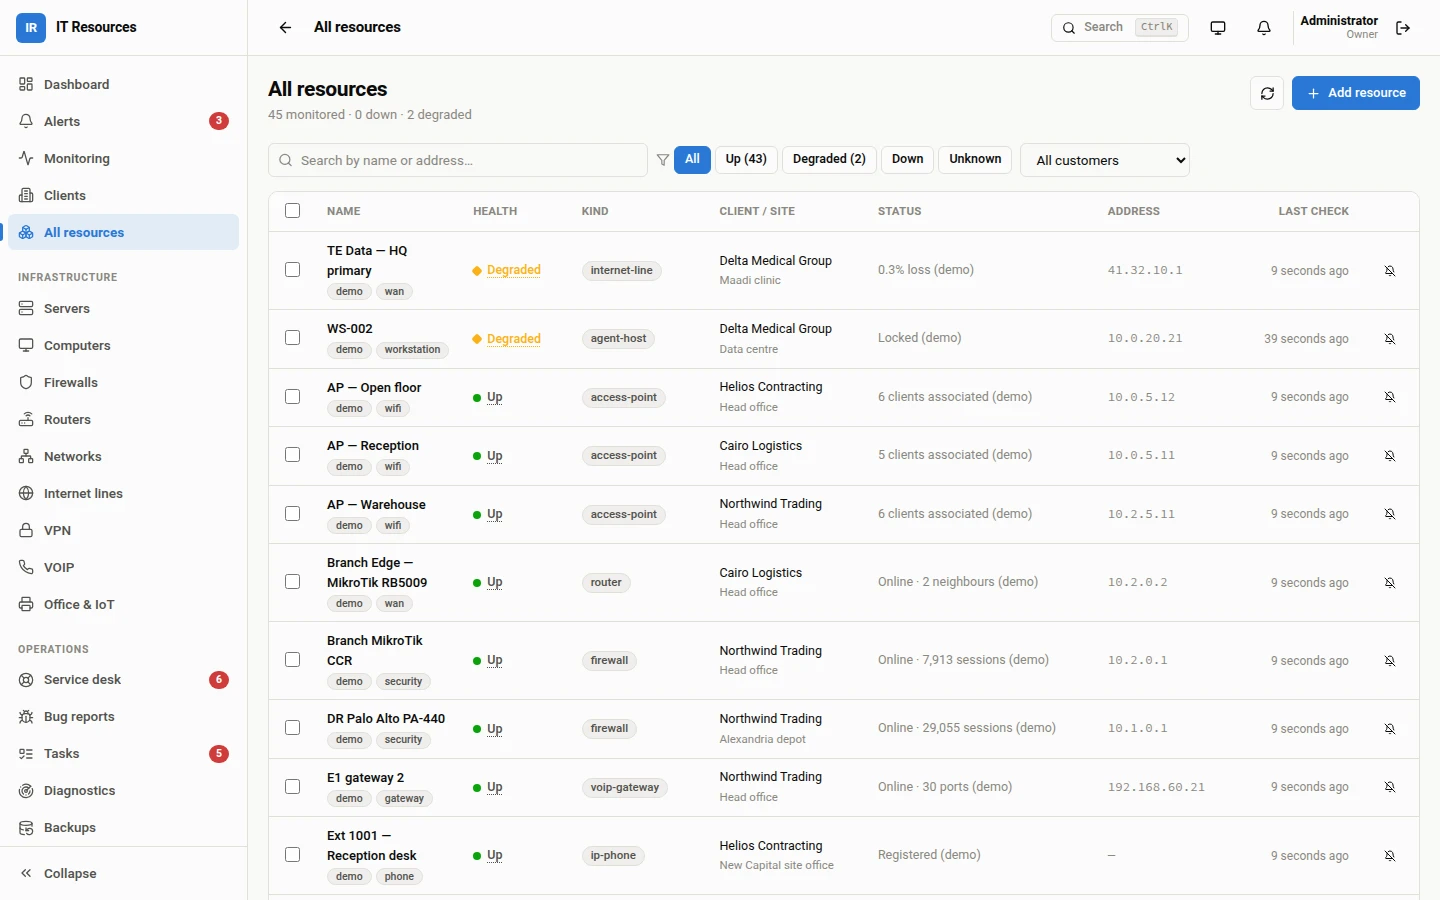
The price is a one-time fee per server: one licence covers one server that IT Resources is installed on, with no recurring charge. Buy for two or more servers and each licence is 25% off. Set the number of servers above and check out. Once your payment is confirmed we email your licence together with download and installation instructions. Screenshots on this page show the product running with built-in demonstration data.
Would you rather not run a server? IT Resources Cloud is the same platform hosted for you, from $149 per month.
Details
- Product type
- Self-hosted server software with web, desktop and mobile clients
- Deployment
- Docker container (recommended) or Node.js 20.11+ on Linux
- Database
- Embedded SQLite; optional SQLCipher encryption
- Monitoring methods
- ICMP, TCP, HTTP, TLS, SNMP, SSH, Redfish, Asterisk AMI, push agent
- Bundled plugins
- 15 – servers, computers, firewalls, routers, networks, internet lines, VPN, VOIP, office & IoT, backups, password safe, billing, service desk, bug reports, core
- Notification channels
- Email (SMTP), SMS (Twilio or HTTP gateway), webhook, in-app, browser push, mobile push
- Multi-tenancy
- Clients and sites with per-client portal access
- Access control
- Built-in and custom roles, groups, per-user overrides, two-factor authentication
- AI assistance
- Optional – Anthropic Claude or local Ollama
- Licence
- One-time fee per server
- Delivery
- Digital – licence and installation instructions by email
- SKU
- ITR